


show disassembly-flavor
(e.g., mov dest,src for intel syntax (windows), mov src,dest for AT&T(unix-like))
disp/i $pc
si
WRITTEN BY
- RootFriend
개인적으로... 나쁜 기억력에 도움되라고 만들게되었습니다.
,
show disassembly-flavor
(e.g., mov dest,src for intel syntax (windows), mov src,dest for AT&T(unix-like))
disp/i $pc
si

.section .data
text: .ascii "hello\n"
.section .text
.globl _start
_start:
    jmp 10000000
    call 7500000
    movl $4, %eax
    movl $1, %ebx
    movl $text, %ecx
    movl $6, %edx
    int $0x80
exit:
    movl $1, %eax
    movl $0, %ebx
int $0x80 #linux equivalent to int 21has lookup.gas -o lookup.o ld -o lookup lookup.o
전엔 몰랐던 기능들... 우연히 아래의 주소에서 읽게되었다.
출처 : http://beej.us/guide/bggdb/
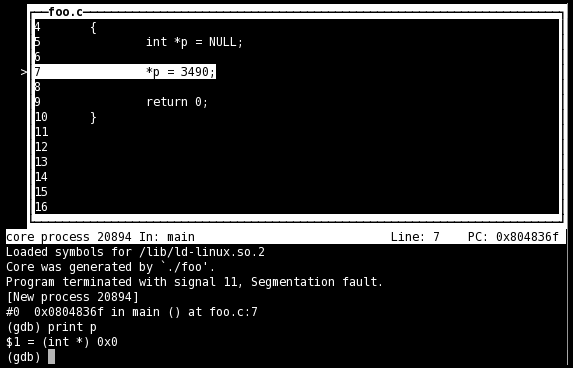
Let's say you build and run a program, and it dumps core on you for some reason or another:
$ cc -g -o foo foo.c
$ ./foo
Segmentation fault (core dumped)
This means that a core file (with a memory snapshot from the time of the crash) has been created with the name "core". If you're not getting a core file (that is, it only says "Segmentation fault" and no core file is created), you might have your ulimit set too low; try typing ulimit -c unlimited at your shell prompt.
You can fire up gdb with the -c option to specify a core file:
$ gdb -tui -c core foo
And, if in TUI mode, you'll be greeted with a screen of information, telling you why the program exited ("signal 11, Segmentation fault"), and the highlight will be on the offending line. (In dumb terminal mode, the offending line is printed out.)
In this example, I print the variable that's causing the problem. Indeed it is NULL:
Even if you don't have all the source code, it's often useful to get a backtrace from the point the program crashed.
In TUI mode, you can get a list of existing windows with the info win command. You can then change which window has focus with the focus (or fs) command. focus takes either a window name, or "prev" or "next" as an argument. Valid window names are "SRC" (source window), "CMD" (command window), "REGS" (registers window), and "ASM" (assembly window). See the next section for how to use these other windows.
Note that when the SRC window has focus, the arrow keys will move the source code, but when the CMD window has focus, the arrow keys will select the previous and next commands in the command history. (For the record, the commands to move the SRC window single lines and single pages are +, -, <, and >.)
(gdb) info win
        SRC     (36 lines)  <has focus>
        CMD     (18 lines)
(gdb) fs next
Focus set to CMD window.
(gdb) info win
        SRC     (36 lines)
        CMD     (18 lines)  <has focus>
(gdb) fs SRC
Focus set to SRC window.
(gdb)
(Window names are case in-sensitive.)
The winheight (or wh) command sets the height of a particular window, but I've had bad luck with this working well.
In TUI mode, the layout command controls which windows you see. Additionally, the tui reg allows control of the register window, and will open it if it's not already open.
The commands are:| layout src | Standard layout—source on top, command window on the bottom |
| layout asm | Just like the "src" layout, except it's an assembly window on top |
| layout split | Three windows: source on top, assembly in the middle, and command at the bottom |
| layout reg | Opens the register window on top of either source or assembly, whichever was opened last |
| tui reg general | Show the general registers |
| tui reg float | Show the floating point registers |
| tui reg system | Show the "system" registers |
| tui reg next | Show the next page of registers—this is important because there might be pages of registers that aren't in the "general", "float", or "system" sets |
Here's a nifty screenshot to whet your appetite, showing source and assembly in "split" mode:
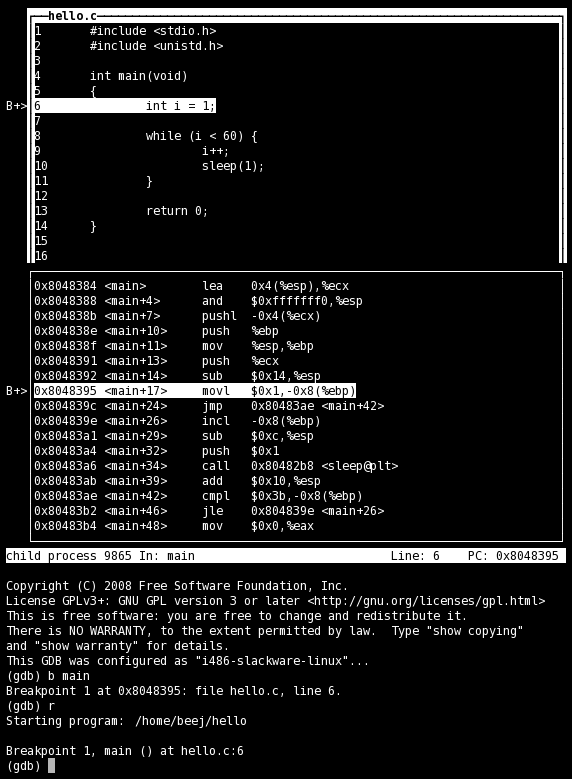
Assembly code comes in two flavors on Intel machines: Intel and AT&T. You can set which one appears in the disassembly window with set disassembly-flavor. Valid values are "intel" and "att". If you already have the assembly window open, you'll have to close it and reopen it (layout src followed by layout split, for example.)
To display registers in dumb terminal mode, type info registers for the integer registers, or info all-registers for everything.
You're thinking, "Wow, this is pretty cool, but I could write a killer front-end for this thing that worked so much better! How do I do it?"
GDB supports what it calls the "machine interface interpreter", or GDB/MI. The interpreter is selected on the gdb command line with the --interpreter switch.
Basically you'll launch gdb and read commands and results to and from it (probably using pipes). Pretty straightforward.
See the GDB documentation for all the details.
Command parameters are in italics. Optional parameters are in square brackets. All commands can be abbreviated until they become ambiguous.
This list is very very incomplete, and only shows things talked about in this tutorial!
| Help Commands | |
| help command | Get help on a certain command |
| apropos keyword | Search help for a particular keyword |
| Starting and Quitting | |
| gdb [-tui] [-c core] [exename] | (Unix Command) Start gdb on an executable or standalone; specify "-tui" to start the TUI GUI; specify "-c" with a corefile name to see where a crash occurred |
| run [arg1] [arg2] [...] | Run the currently loaded program with the given command line arguments |
| quit | Exit the debugger |
| file exename | Load an executable file by name |
| Breakpoints and Watchpoints | |
| break location | Set a breakpoint at a location, line number, or file (e.g. "main", "5", or "hello.c:23") |
| watch expression | Break when a variable is written to |
| rwatch expression | Break when a variable is read from |
| awatch expression | Break when a variable is written to or read from |
| info break | Display breakpoint and watchpoint information and numbers |
| info watch | Same as info break |
| clear location | Clear a breakpoint from a location |
| delete num | Delete a breakpoint or watchpoint by number |
| Stepping and Running | |
| next | Run to the next line of this function |
| step | Step into the function on this line, if possible |
| stepi | Step a single assembly instruction |
| continue | Keep running from here |
| CTRL-C | Stop running, wherever you are |
| finish | Run until the end of the current function |
| advance location | Advance to a location, line number, or file (e.g. "somefunction", "5", or "hello.c:23") |
| jump location | Just like continue, except jump to a particular location first. |
| Examining and Modifying Variables | |
| display expression | Display the value of a variable or expression every step of the program—the expression must make sense in the current scope |
| info display | Show a list of expressions currently being displayed and their numbers |
| undisplay num | Stop showing an expression identified by its number (see info display) |
| print expression | Print the value of a variable or expression |
| printf formatstr expressionlist | Do some formatted output with printf() e.g. printf "i = %d, p = %s\n", i, p |
| set variable expression | Set a variable to value, e.g. set variable x=20 |
| set (expression) | Works like set variable |
| Window Commands | |
| info win | Shows current window info |
| focus winname | Set focus to a particular window bby name ("SRC", "CMD", "ASM", or "REG") or by position ("next" or "prev") |
| fs | Alias for focus |
| layout type | Set the window layout ("src", "asm", "split", or "reg") |
| tui reg type | Set the register window layout ("general", "float", "system", or "next") |
| winheight val | Set the window height (either an absolute value, or a relative value prefaced with "+" or "-") |
| wh | Alias for winheight |
| set disassembly-flavor flavor | Set the look-and-feel of the disassembly. On Intel machines, valid flavors are intel and att |
| Misc Commands | |
| RETURN | Hit RETURN to repeat the last command |
| backtrace | Show the current stack |
| bt | Alias for backtrace |
| attach pid | Attach to an already-running process by its PID |
| info registers | Dump integer registers to screen |
| info all-registers | Dump all registers to screen |